![]()
The Web Suite Dashboard contains real-time information that project managers as well as company executives like principals, partners, owners, etc. need to monitor the overall progress of their company and business. Rather than run reports and then read them one after another to find exceptions and visualize trends, the Dashboard enables you to view important business metrics at-a-glance and keep track of the key performance indicators.
The Dashboard contains various panels that extract information from your Web Suite database and present it in the form of charts for the selected year. Up to four panels display on the Dashboard with drag-and-drop functionality; you can choose to view fewer or more panels on the screen. Using the Action drop-down list on each panel, you can print the charts or apply filters on the charts. Only users with appropriate security permission can access the Dashboard and control its panels.
The panels include:
Company
Management
Billing
Time and Expense
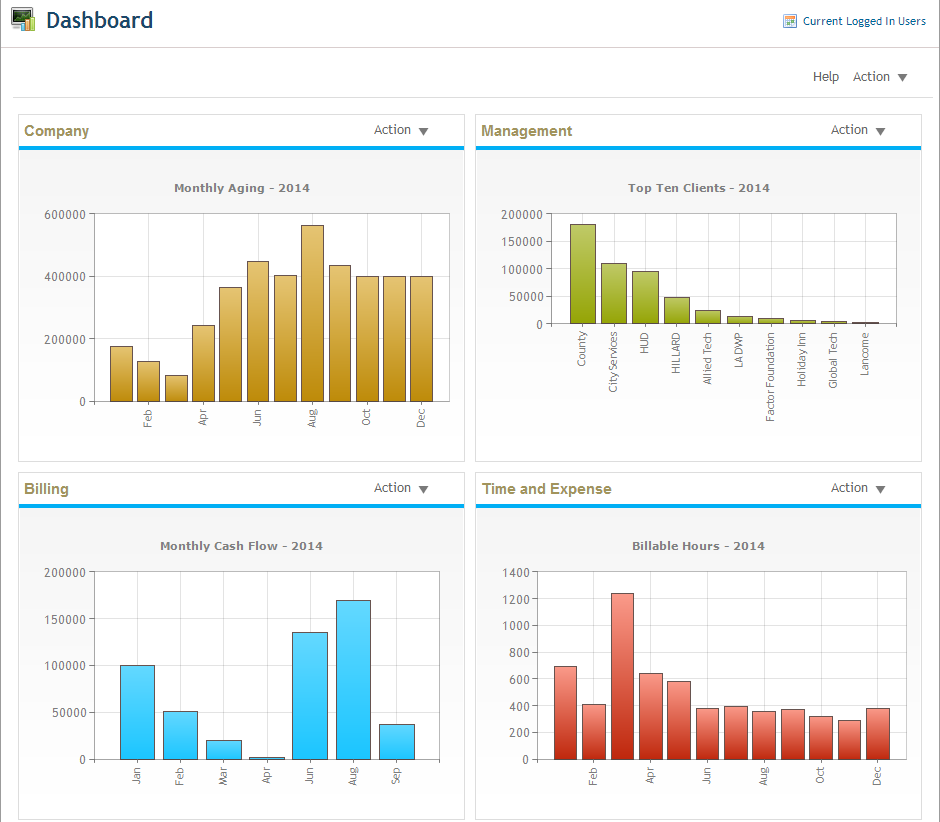
The Company panel can display the following charts. You can choose the desired chart and year from the Action>Filters drop-down list.
The Management panel can display the following charts. You can choose the desired chart and year from the Action>Filters drop-down list.
The Billing panel can display the following charts. You can choose the desired chart and year from the Action>Filters drop-down list.
The Time and Expense panel can display the following charts. You can choose the desired chart and year from the Action>Filters drop-down list.
![]()